Zabbix(四) : 通过修改Zabbix官方redis模板监控微软云Azure上多台MySQL实例,zabbixredis
Zabbix(四) : 通过修改Zabbix官方redis模板监控微软云Azure上多台MySQL实例,zabbixredis
由于微软云上的MySQL实例无法安装插件来导出数据,因此参考上一篇 通过Zabbix官方模板监控微软云Azure上多台Redis实例, 我们可以修改zabbix官方redis脚本,通过show status等命令获取到mysql的状态指标,用trap-messages模式发送给zabbix来监控微软云上的MySQL实例。
1. 运行环境:
OS:CentOS 7.3 / Python: 2.7.3/ Pip: 9.0.1 / Zabbix:3.2.8 / MySQL:微软云MySQL 5.7
Zabbix官方提供的redis监控模板,我们修改官方提供的python脚本来监控MySQL。
项目地址:https://github.com/blacked/zbx_redis_template
Zabbix所有官方模板:http://www.zabbix.org/wiki/Zabbix_Templates
2. 部署
trap-messages方式的说明请参考上一篇 通过Zabbix官方模板监控微软云Azure上多台Redis实例。
1> 安装Python依赖
# yum -y install python-pip
# pip install argparse
# pip install pymysql
2> 将zbx_redis_stats.py放到zabbix服务器上某路径下并重命名,如/etc/zabbix/script/mysql/zbx_mysql_stats.py。
3> 修改脚本,下面是我修改的脚本,监控了show status获取的信息以及数据库表占用的空间等信息,可以直接拷贝,或者添加自己需要监控的其他信息。

  1 # !/usr/bin/python
  2
  3 import sys, pymysql, json, re, struct, time, socket, argparse
  4
  5 parser = argparse.ArgumentParser(description='Zabbix MySQL status script')
  6 parser.add_argument('mysql_hostname', nargs='?')
  7 parser.add_argument('metric', nargs='?')
  8 parser.add_argument('db', default='none', nargs='?')
  9 parser.add_argument('-p', '--port', dest='mysql_port', action='store', help='MySQL server port', default=3306, type=int)
 10 parser.add_argument('-a', '--auth', dest='mysql_pass', action='store', help='MySQL server pass', default=None)
 11 parser.add_argument('-u', '--user', dest='mysql_user', action='store', help='MySQL server user', default=None)
 12 args = parser.parse_args()
 13
 14 zabbix_host = '127.0.0.1'  # Zabbix Server IP
 15 zabbix_port = 10051  # Zabbix Server Port
 16
 17 # Name of monitored server like it shows in zabbix web ui display
 18 mysql_hostname = args.mysql_hostname if args.mysql_hostname else socket.gethostname()
 19
 20
 21 class Metric(object):
 22     def __init__(self, host, key, value, clock=None):
 23         self.host = host
 24         self.key = key
 25         self.value = value
 26         self.clock = clock
 27
 28     def __repr__(self):
 29         result = None
 30         if self.clock is None:
 31             result = 'Metric(%r, %r, %r)' % (self.host, self.key, self.value)
 32         else:
 33             result = 'Metric(%r, %r, %r, %r)' % (self.host, self.key, self.value, self.clock)
 34         return result
 35
 36
 37 def value_format(value):
 38     if value.isdigit() is True:
 39         value = int(value)
 40     return value
 41
 42
 43 def send_to_zabbix(metrics, zabbix_host='127.0.0.1', zabbix_port=10051):
 44     result = None
 45     j = json.dumps
 46     metrics_data = []
 47     for m in metrics:
 48         clock = m.clock or ('%d' % time.time())
 49         metrics_data.append(
 50             ('{"host":%s,"key":%s,"value":%s,"clock":%s}') % (j(m.host), j(m.key), j(m.value), j(clock)))
 51     json_data = ('{"request":"sender data","data":[%s]}') % (','.join(metrics_data))
 52     data_len = struct.pack('<Q', len(json_data))
 53     packet = 'ZBXD\x01' + data_len + json_data
 54
 55     # For debug:
 56     # print(packet)
 57     # print(':'.join(x.encode('hex') for x in packet))
 58
 59     try:
 60         zabbix = socket.socket()
 61         zabbix.connect((zabbix_host, zabbix_port))
 62         zabbix.sendall(packet)
 63         resp_hdr = _recv_all(zabbix, 13)
 64         if not resp_hdr.startswith('ZBXD\x01') or len(resp_hdr) != 13:
 65             print('Wrong zabbix response')
 66             result = False
 67         else:
 68             resp_body_len = struct.unpack('<Q', resp_hdr[5:])[0]
 69             resp_body = zabbix.recv(resp_body_len)
 70             zabbix.close()
 71
 72             resp = json.loads(resp_body)
 73             # For debug
 74             # print(resp)
 75             if resp.get('response') == 'success':
 76                 result = True
 77             else:
 78                 print('Got error from Zabbix: %s' % resp)
 79                 result = False
 80     except:
 81         print('Error while sending data to Zabbix')
 82         result = False
 83     finally:
 84         return result
 85
 86
 87 def _recv_all(sock, count):
 88     buf = ''
 89     while len(buf) < count:
 90         chunk = sock.recv(count - len(buf))
 91         if not chunk:
 92             return buf
 93         buf += chunk
 94     return buf
 95
 96
 97 def main():
 98     if mysql_hostname and args.metric:
 99
100         client = pymysql.connect(host=mysql_hostname, user=args.mysql_user, password=args.mysql_pass)
101         cursor = client.cursor()
102         cursor.execute("show status")
103         data = cursor.fetchall()
104         dict_local = {}
105         for k, v in data:
106             dict_local[k] = v
107
108         cursor.execute("select SCHEMA_NAME from information_schema.schemata ")
109         db = cursor.fetchall()
110         dblist = []
111         for i in db:
112             dblist.append(i[0])
113
114         if args.metric:
115             def list_db():
116                 if args.db in dblist:
117                     print(dblist)
118                 else:
119                     print('database_detect')
120
121             def default():
122                 if args.metric in dict_local.keys():
123                     print(dict_local[args.metric])
124
125             {
126                 'list_db': list_db
127             }.get(args.metric, default)()
128
129         else:
130             print('Not selected metric')
131     else:
132         client = pymysql.connect(host=mysql_hostname, user=args.mysql_user, password=args.mysql_pass)
133         cursor = client.cursor()
134         cursor.execute("show status")
135         data = cursor.fetchall()
136
137         a = []
138         for k, v in data:
139             k = k.lower()
140             v = value_format(v)
141             a.append(Metric(mysql_hostname, ('azuremysql[%s]' % k), v))
142
143         # cursor.execute("show processlist;")
144         cursor.execute("select count(*) from information_schema.processlist;")
145         processdata = cursor.fetchall()
146         # process_count = len(processdata)
147         process_count = processdata[0][0]
148         a.append(Metric(mysql_hostname, 'azuremysql[process_count]', process_count))
149
150         cursor.execute(
151             "select table_schema,round(sum(data_length+index_length)/1024/1024,4) from information_schema.tables group by table_schema;")
152         spacedata = cursor.fetchall()
153         totalspace = 0
154         for k, v in spacedata:
155             a.append(Metric(mysql_hostname, ('azuremysql[%s]' % k), float(v)))
156             totalspace += float(v)
157         a.append(Metric(mysql_hostname, 'azuremysql[totalspace]', totalspace))
158
159         # Send packet to zabbix
160         send_to_zabbix(a, zabbix_host, zabbix_port)
161         # for i in a:
162         #   print(i)
163         cursor.close()
164         client.close()
165
166
167 if __name__ == '__main__':
168     main()
zbx_mysql_stats.py
zbx_mysql_stats.py
4> 测试脚本是否可以正常连接到微软云上MySQL并获取参数:
/etc/zabbix/script/mysql/zbx_mysql_status.py -u mysqluser -a mysqlpasswd test.mysqldb.chinacloudapi.cn list_db
5> 添加crontab,定期执行脚本发送数据给zabbix,注意若密码中含有%需要用 \ 进行转义 (\%)。
若要监控多台MySQL,则添加多个crontab:
*/1 * * * * /etc/zabbix/script/mysql/zbx_mysql_status.py -u mysqluser -a mysqlpasswd test.mysqldb.chinacloudapi.cn
6> 创建MySQL监控模板,注意监控项类型应选择"zabbix采集器",若使用的脚本,键值为"azuremysql[xxxxxxx]",否则请使用自己脚本定义的键值。
附件是我创建的一个模板,添加了一些监控项,并不完整,可以在此基础上再添加需要的监控项。
zbx_Azure_MySQL_template.xml
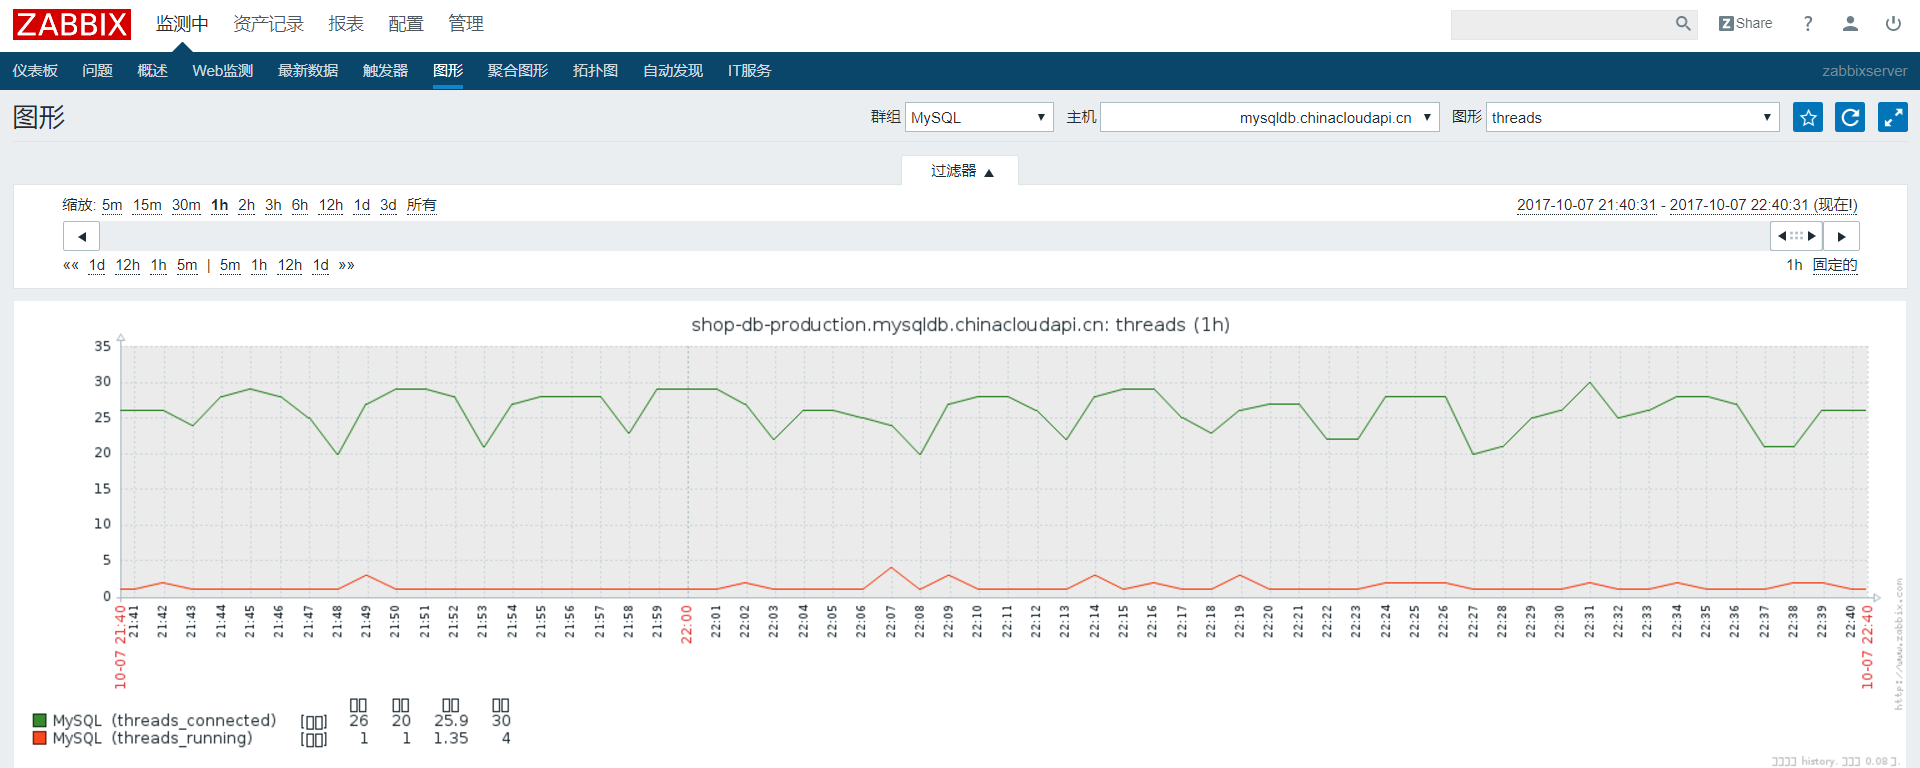
7> 使用MySQL hostname创建主机,链接模板,即可实现zabbix监控。
评论暂时关闭