ELK搭建与使用详解,
ELK搭建与使用详解,
1.环境部署
| 安装软件 | 主机名 | IP地址 | 内存需求 |
|---|---|---|---|
| Elasticsearch | mes | 192.168.13.142 | 至少3G |
| Logstash | log | 192.168.13.143 | 至少2G |
| head,Kibana | head-kib | 192.168.13.139 | 至少2G |
地址与版本
Elasticsearch: 6.5.4  #https://artifacts.elastic.co/downloads/elasticsearch/elasticsearch-6.5.4.tar.gz
Logstash: 6.5.4  #https://artifacts.elastic.co/downloads/logstash/logstash-6.5.4.tar.gz
Kibana: 6.5.4  #https://artifacts.elastic.co/downloads/kibana/kibana-6.5.4-linux-x86_64.tar.gz
Kafka: 2.11-2.1  #https://archive.apache.org/dist/kafka/2.1.0/kafka_2.11-2.1.0.tgz
Filebeat: 6.5.4
相应的版本最好下载对应的插件
相关地址:
官网地址
2.Elasticsearch部署
系统类型:Centos7.5
节点IP:172.16.13.142
软件版本:jdk-8u211-linux-x64.tar.gz、elasticsearch-6.5.4.tar.gz
1.安装配置jdk
JDK下载地址
[root@mes ~]# tar xzf jdk-8u211-linux-x64.tar.gz -C /usr/local/ #解压
[root@mes ~]# cd /usr/local/
[root@mes local]# mv jdk1.8.0_211/ java
[root@mes local]# echo '
JAVA_HOME=/usr/local/java
PATH=$JAVA_HOME/bin:$PATH
export JAVA_HOME PATH
' >>/etc/profile
[root@mes local]# source /etc/profile
[root@mes local]# java -version   #出现版本号就代表jdk配置成功
java version "1.8.0_211"
Java(TM) SE Runtime Environment (build 1.8.0_211-b12)
Java HotSpot(TM) 64-Bit Server VM (build 25.211-b12, mixed mode)
2.安装配置ES
[root@mes ~]# useradd elsearch #创建运行用户
[root@mes ~]# echo "123456" | passwd --stdin "elsearch"  #设置密码
[root@mes ~]# tar xzf elasticsearch-6.5.4.tar.gz -C /usr/local/
[root@mes ~]# cd /usr/local/elasticsearch-6.5.4/config/
[root@mes config]# cp elasticsearch.yml elasticsearch.yml.bak #备份
[root@mes config]# vim elasticsearch.yml
# 在最后一行添加如下内容
cluster.name: elk
node.name: elkyjssjm
node.master: true
node.data: true
path.data: /data/elasticsearch/data
path.logs: /data/elasticsearch/logs
bootstrap.memory_lock: false
bootstrap.system_call_filter: false
network.host: 0.0.0.0
http.port: 9200
http.cors.enabled: true
http.cors.allow-origin: "*"
#discovery.zen.ping.unicast.hosts: ["192.168.246.234", "192.168.246.231","192.168.246.235"]
#discovery.zen.minimum_master_nodes: 2
#discovery.zen.ping_timeout: 150s
#discovery.zen.fd.ping_retries: 10
#client.transport.ping_timeout: 60s
参数详解
cluster.name        集群名称,各节点配成相同的集群名称。
node.name       节点名称,各节点配置不同。
node.master     指示某个节点是否符合成为主节点的条件。
node.data       指示节点是否为数据节点。数据节点包含并管理索引的一部分。
path.data       数据存储目录。
path.logs       日志存储目录。
bootstrap.memory_lock       内存锁定,是否禁用交换。
bootstrap.system_call_filter    系统调用过滤器。
network.host    绑定节点IP。
http.port       端口。
discovery.zen.ping.unicast.hosts    提供其他 Elasticsearch 服务节点的单点广播发现功能。
discovery.zen.minimum_master_nodes  集群中可工作的具有Master节点资格的最小数量,官方的推荐值是(N/2)+1,其中N是具有master资格的节点的数量。
discovery.zen.ping_timeout      节点在发现过程中的等待时间。
discovery.zen.fd.ping_retries        节点发现重试次数。
http.cors.enabled               是否允许跨源 REST 请求,表示支持所有域名,用于允许head插件访问ES。
http.cors.allow-origin              允许的源地址。
设置JVM堆大小,一般设置为内存的一半,但最少2G
[root@mes ~]# sed -i 's/-Xms1g/-Xms2g/' /usr/local/elasticsearch-6.5.4/config/jvm.options
[root@mes ~]# sed -i 's/-Xmx1g/-Xmx2g/' /usr/local/elasticsearch-6.5.4/config/jvm.options
创建ES数据及日志存储目录并修改属主和属组,与上面配置文件中的路径一一对应
[root@mes ~]# mkdir -p /data/elasticsearch/data
[root@mes ~]# mkdir -p /data/elasticsearch/logs
[root@mes ~]# chown -R elsearch:elsearch /data/elasticsearch   #给刚刚创建的目录修改属主和属组
[root@mes ~]# chown -R elsearch:elsearch /usr/local/elasticsearch-6.5.4
系统优化:
1.增加最大进程数
[root@mes ~]# vim /etc/security/limits.conf
#在文件最后面添加如下内容
* soft nofile 65536
* hard nofile 131072
* soft nproc 2048
* hard nproc 4096
================================================================
解释:
soft  xxx  : 代表警告的设定,可以超过这个设定值,但是超过后会有警告。
hard  xxx  : 代表严格的设定,不允许超过这个设定的值。
nofile : 是每个进程可以打开的文件数的限制
nproc  : 是操作系统级别对每个用户创建的进程数的限制
================================================================
2.增加最大内存映射数
[root@mes ~]# vim /etc/sysctl.conf
#添加如下
vm.max_map_count=262144  #elasticsearch用户拥有的内存权限太小,至少需要262144;
vm.swappiness=0			#表示最大限度使用物理内存,在内存不足的情况下,然后才是swap空间
[root@mes ~]# su - elsearch
Last login: Sat Aug  3 19:48:59 CST 2019 on pts/0
[root@mes ~]$ cd /usr/local/elasticsearch-6.5.4/
[root@mes elasticsearch-6.5.4]$ ./bin/elasticsearch  #先启动看看报错不,需要多等一会
终止之后(等cpu降下来再终止)
[root@mes elasticsearch-6.5.4]$ nohup ./bin/elasticsearch &  #放后台启动
[1] 11462
nohup: ignoring input and appending output to ‘nohup.out’
[root@mes elasticsearch-6.5.4]$ tail -f nohup.out   #看一下是否启动
或者:
su - elsearch -c "cd /usr/local/elasticsearch-6.5.4 && nohup bin/elasticsearch &"
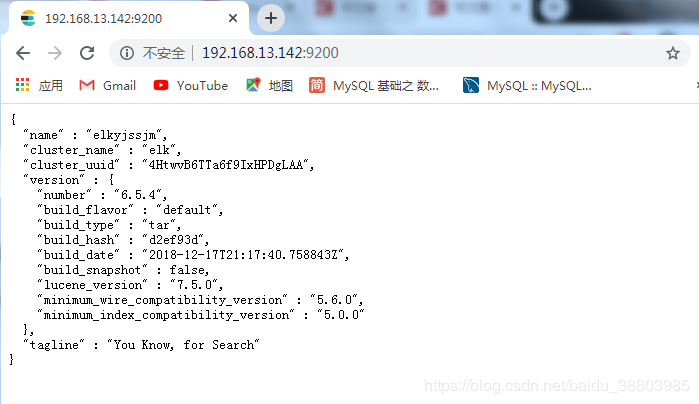
测试:访问http://192.168.13.142:9200/ 记得加端口9200
3.head,Kibana安装配置
系统类型:Centos7.5
节点IP:172.16.13.139
软件版本:node-v4.4.7-linux-x64.tar.gz、elasticsearch-head-master.zip、phantomjs-2.1.1-linux-x86_64.tar.bz2、kibana-6.5.4-linux-x86_64.tar.gz
1.head及其插件的安装配置
1.安装node
[root@head-kib ~]# wget https://npm.taobao.org/mirrors/node/latest-v4.x/node-v4.4.7-linux-x64.tar.gz
[root@head-kib ~]# tar -zxf node-v4.4.7-linux-x64.tar.gz –C /usr/local
[root@head-kib ~]# vim /etc/profile
#在最后添加如下变量
NODE_HOME=/usr/local/node-v4.4.7-linux-x64
PATH=$NODE_HOME/bin:$PATH
export NODE_HOME PATH
[root@head-kib ~]# source /etc/profile
[root@head-kib ~]# node --version  #检查node版本号
v4.4.7
2.下载head插件grunt
[root@head-kib ~]# wget https://github.com/mobz/elasticsearch-head/archive/master.zip
[root@head-kib ~]# cp elasticsearch-head-master.zip /usr/local/
[root@head-kib ~]# yum -y install unzip
[root@head-kib local]# cd /usr/local
[root@head-kib local]# unzip  elasticsearch-head-master.zip
[root@head-kib local]# cd elasticsearch-head-master/
[root@head-kib elasticsearch-head-master]# npm config set registry https://registry.npm.taobao.org #改源地址,要不然下面的安装时间会特别长
[root@head-kib elasticsearch-head-master]# npm install -g grunt-cli  #安装grunt
[root@head-kib elasticsearch-head-master]# grunt --version  #检查grunt版本号
grunt-cli v1.3.2
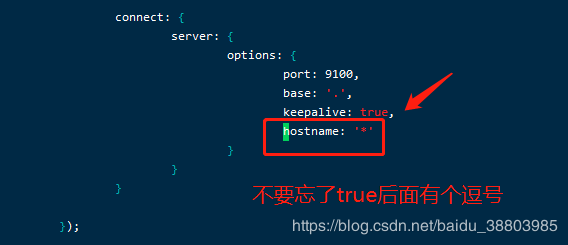
[root@head-kib elasticsearch-head-master]# vim /usr/local/elasticsearch-head-master/Gruntfile.js
#在95行左右
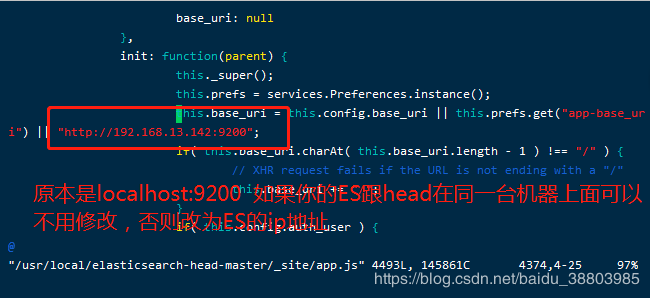
[root@head-kib elasticsearch-head-master]# vim /usr/local/elasticsearch-head-master/_site/app.js
#在4374行左右
3.下载head必要的文件
[root@head-kib ~]# wget https://github.com/Medium/phantomjs/releases/download/v2.1.1/phantomjs-2.1.1-linux-x86_64.tar.bz2
[root@head-kib ~]# yum -y install bzip2
[root@head-kib ~]# tar -jxf phantomjs-2.1.1-linux-x86_64.tar.bz2 -C /tmp/  #解压
4.运行head
[root@head-kib ~]# cd /usr/local/elasticsearch-head-master/
[root@head-kib elasticsearch-head-master]# npm config set registry https://registry.npm.taobao.org
[root@head-kib elasticsearch-head-master]# npm install
...
grunt-contrib-jasmine@1.0.3 node_modules/grunt-contrib-jasmine
├── sprintf-js@1.0.3
├── lodash@2.4.2
├── es5-shim@4.5.13
├── chalk@1.1.3 (escape-string-regexp@1.0.5, supports-color@2.0.0, ansi-styles@2.2.1, strip-ansi@3.0.1, has-ansi@2.0.0)
├── jasmine-core@2.99.1
├── rimraf@2.6.3 (glob@7.1.4)
└── grunt-lib-phantomjs@1.1.0 (eventemitter2@0.4.14, semver@5.7.0, temporary@0.0.8, phan
[root@head-kib elasticsearch-head-master]# nohup grunt server &
[root@head-kib elasticsearch-head-master]# tail -f nohup.out
Running "connect:server" (connect) task
Waiting forever...
Started connect web server on http://localhost:9100
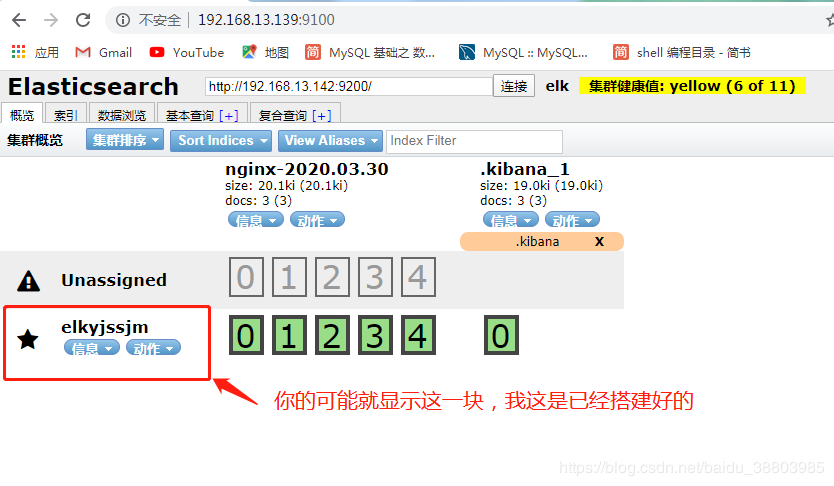
测试:访问http://192.168.13.139:9100/
2.Kibana部署
1.安装和配置
[root@head-kib ~]# tar zvxf kibana-6.5.4-linux-x86_64.tar.gz -C /usr/local/
[root@head-kib ~]# cd /usr/local/kibana-6.5.4-linux-x86_64/config/
[root@head-kib config]# vim kibana.yml
#在末尾添加以下内容
server.port: 5601
server.host: "192.168.13.139"  #本机
elasticsearch.url: "http://192.168.13.142:9200" #ES节点
kibana.index: ".kibana"
====================================================================================
server.port kibana 服务端口,默认5601
server.host kibana 主机IP地址,默认localhost
elasticsearch.url  用来做查询的ES节点的URL,默认http://localhost:9200
kibana.index       kibana在Elasticsearch中使用索引来存储保存的searches, visualizations和dashboards,默认.kibana
=====================================================================================
2.启动
[root@head-kib config]# cd ..
[root@head-kib kibana-6.5.4-linux-x86_64]# nohup ./bin/kibana &
[1] 12054
[root@head-kib kibana-6.5.4-linux-x86_64]# nohup: ignoring input and appending output to ‘nohup.out’
我们可以用nginx进行反向代理,不至于显示出我们真正的IP和端口号
我是在这一台上面部署了nginx,在任意一台部署都可以
[root@head-kib ~]# rpm -ivh http://nginx.org/packages/centos/7/noarch/RPMS/nginx-release-centos-7-0.el7.ngx.noarch.rpm   #下载源
[root@head-kib ~]# yum -y install nginx #安装
[root@head-kib ~]# cd /etc/nginx/conf.d/
[root@head-kib conf.d]# cp default.conf default.conf.bak #备份
[root@head-kib conf.d]# vim default.conf
#清空并添加以下内容
server {
        listen       80;
        server_name  192.168.13.139;  #你的nginx所在的机器
        #charset koi8-r;
        # access_log  /var/log/nginx/host.access.log  main;
        # access_log off;

         location / {
             proxy_pass http://192.168.13.139:5601; #kibana所在的机器
             proxy_set_header Host $host:5601;
             proxy_set_header X-Real-IP $remote_addr;
             proxy_set_header X-Forwarded-For $proxy_add_x_forwarded_for;
             proxy_set_header Via "nginx";
                     }
         location /status {
             stub_status on; #开启网站监控状态
             access_log /var/log/nginx/kibana_status.log; #监控日志
             auth_basic "NginxStatus"; }

         location /head/{
             proxy_pass http://192.168.246.13.139:9100; #head所在的机器
             proxy_set_header Host $host:9100;
             proxy_set_header X-Real-IP $remote_addr;
             proxy_set_header X-Forwarded-For $proxy_add_x_forwarded_for;
             proxy_set_header Via "nginx";
                         }
}
root@head-kib ~]# systemctl start nginx  #启动nginx
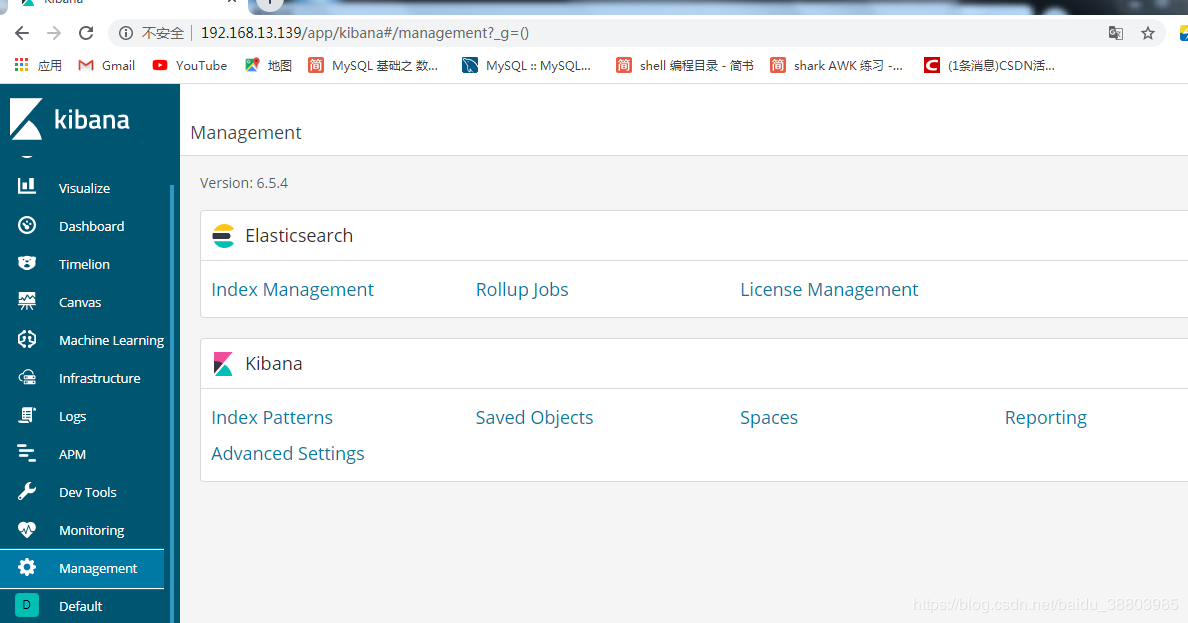
测试:访问 http://192.168.13.139/
刚开始没数据,会提示你创建新的数据

4.Logstash部署
系统类型:Centos7.5
节点IP:192.168.13.143
软件版本:jdk-8u121-linux-x64.tar.gz、logstash-6.5.4.tar.gz
Logstash运行同样依赖jdk,本次为节省资源,故将Logstash安装在了kafka244.231节点。
你想收集哪台机器上的信息就将Logstash安装到哪台上。
1.安装配置jdk
[root@log ~]# tar xzf jdk-8u211-linux-x64.tar.gz -C /usr/local/ #解压
[root@log ~]# cd /usr/local/
[root@log local]# mv jdk1.8.0_211/ java
[root@log local]# echo '
JAVA_HOME=/usr/local/java
PATH=$JAVA_HOME/bin:$PATH
export JAVA_HOME PATH
' >>/etc/profile
[root@log local]# source /etc/profile
[root@log local]# java -version   #出现版本号就代表jdk配置成功
java version "1.8.0_211"
Java(TM) SE Runtime Environment (build 1.8.0_211-b12)
Java HotSpot(TM) 64-Bit Server VM (build 25.211-b12, mixed mode)
2.安装配置Logstash
[root@log ~]# tar xvzf logstash-6.5.4.tar.gz -C /usr/local/ #安装
创建目录,将输入输出都放在该目录里面
[root@log ~]# mkdir -p /usr/local/logstash-6.5.4/etc/conf.d
[root@log ~]# cd /usr/local/logstash-6.5.4/etc/conf.d/
[root@log conf.d]# vim input.conf
#在下面添加
input{                        #让logstash可以读取特定的事件源。
   	file{                                       #从文件读取
   		path => ["/var/log/nginx/access_json.log"]        #要输入的文件路径
	#   code => "json"               #定义编码,用什么格式输入和输出,由于日志就是json格式,这里不用再写
        type => "nginx"                       #定义一个类型,通用选项. 用于激活过滤器
    }
}
output{           #输出插件,将事件发送到特定目标
    elasticsearch {            #输出到es
    	hosts => ["192.168.13.142:9200"]       #指定es服务的ip加端口
    	index => ["%{type}-%{+YYYY.MM.dd}"]     #引用input中的type名称,定义输出的格式
    }
}
我们这里以nginx的日志为例
[root@log ~]# cd
[root@log ~]# rpm -ivh http://nginx.org/packages/centos/7/noarch/RPMS/nginx-release-centos-7-0.el7.ngx.noarch.rpm
[root@log ~]# yum install -y nginx
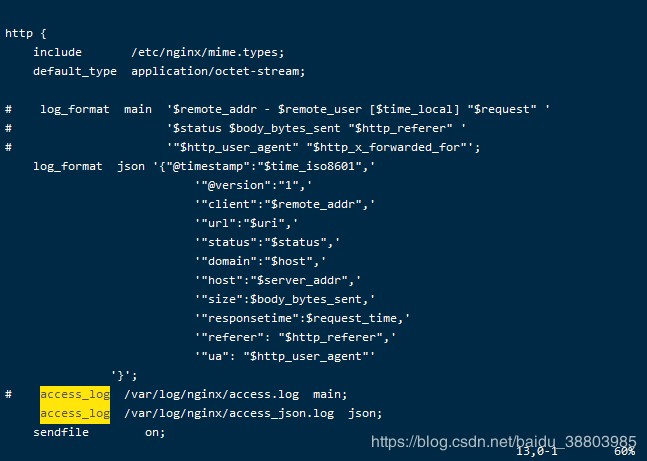
将原来的日志格式注释掉定义成json格式:
[root@log conf.d]# vim /etc/nginx/nginx.conf
# 在http模块里面添加
log_format json '{"@timestamp":"$time_iso8601",'
'"@version":"1",'
'"client":"$remote_addr",'
'"url":"$uri",'
'"status":"$status",'
'"domain":"$host",'
'"host":"$server_addr",'
'"size":$body_bytes_sent,'
'"responsetime":$request_time,'
'"referer": "$http_referer",'
'"ua": "$http_user_agent"'
'}';
access_log /var/log/nginx/access_json.log json; #引用定义的json格式的日志:
启动nginx
[root@log ~]# systemctl start nginx
[root@log ~]# systemctl enable nginx
启动logstash
[root@log ~]# cd /usr/local/logstash-6.5.4/
[root@log logstash-6.5.4]# nohup bin/logstash -f etc/conf.d/  --config.reload.automatic &
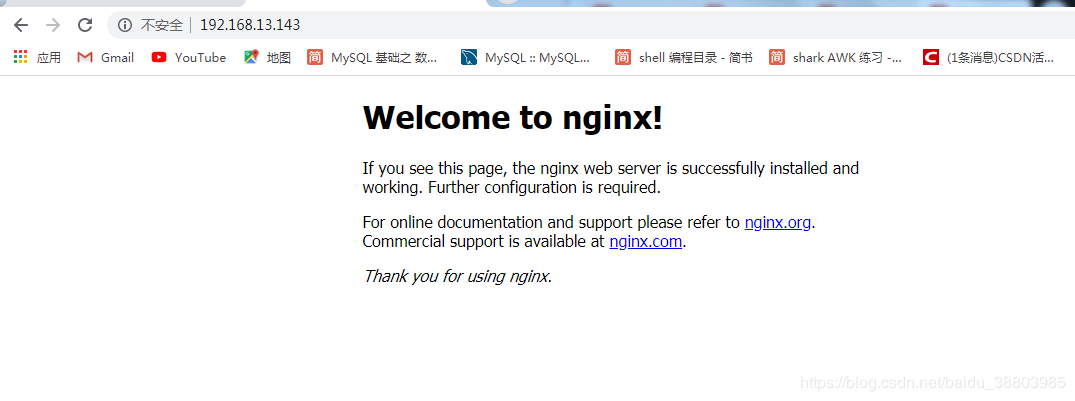
访问http://192.168.13.143/ 多刷新几次效果更明显
然后去head插件页面查看是否有nginx索引出现 http://192.168.13.139:9100/
发现之后,去配置kibanna添加索引
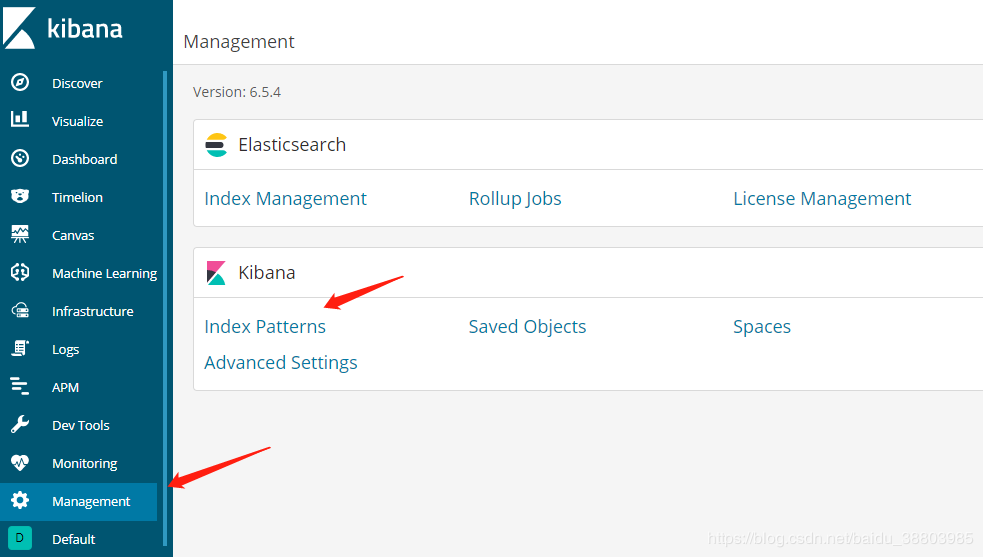

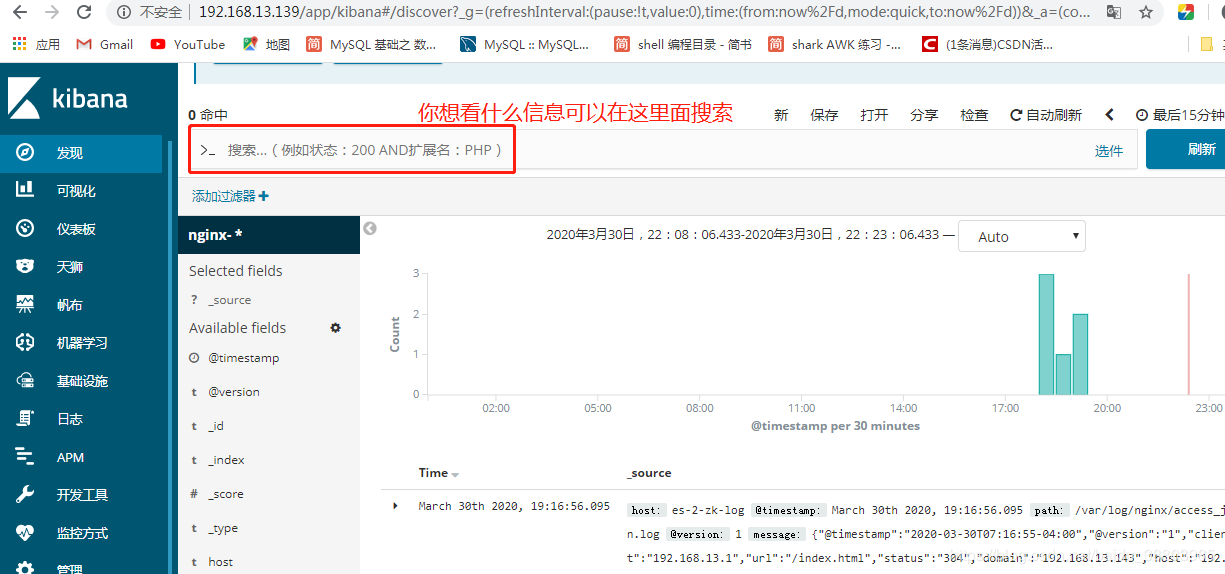
然后你就能看见nginx日志的可视化界面了。
你们的评论和点赞是我写文章的最大动力,蟹蟹。
评论暂时关闭